
How to Determine Buying Power Per Account
What gets measured gets done. This maxim is attributed to Peter Drucker, Tom Peters, Edwards Deming, Lord Kelvin, among others. What matters is whether you believe in it.
In professional selling, whether it is business-to-business (B2B), business-to-business-to-consumer (B2B2C) or business-to-government (B2G), the perennial question is: Are top salesmen born or made? Must successful salesmen be born with the requisite sales instincts? Or can someone (maybe you) learn to become successful in sales without them?
The best place to start is whether you view selling as an art or science. The more appropriate view is that it is both. This perspective can and does exist, particularly in the most successful organizations.
When considering selling and sales as an art, or soft skill, it is often linked to a person’s personality and his communication skills. Further, when considering it an art, particularly in the context of sales management, it often is represented as the ability to recruit and coach good people to perform at a high level.
Alternatively, think science. We collect data about activities and tasks and measure in units such as dollar sales, unit volumes, or profitability percentages, aka metrics.
These are standards of performance upon which business decisions can be made without much consideration given to the soft skills used to achieve the results. More often, these metrics are thought of as a result of selling behaviors or hard skills that anyone can repeat and will likely yield the same results.
Aspiring sales managers often believe such behaviors can be taught and learned by sales personnel with a basic level of social skills. In this narrow context, sales managers are seen as mere administrators who review sales activities, selling tasks and performance metrics, then take corrective action as needed to maintain the performance of the system.
Granted, sales force metrics do provide valuable measures for determining whether sales efforts and selling coverages are effective. So, thinking of sales as a science, at least data science, has some validity.
Many organizations describe the buy-sell cycle as a pipeline. Examples of pipeline metrics that provide worthwhile benefits include evaluation of selling cycle activities such as lead generation, follow-up and customer service and conversion to sales. Beyond determining who ultimately buys, other measures can be applied to evaluate productivity, efficiency and costs, including selling and administrative expenses, at each stage of selling.
Think about how you buy as a consumer. It starts with awareness of your need, moves to research (often conducted on the internet), then proceeds to evaluation and analysis based upon your criteria, then you choose and buy. After use, you evaluate whether the product or service fulfilled your needs and whether the interaction met or exceeded your expectations.
The business buying cycle is similar, except that most businesses don’t like to go through this process with every purchase because they make so many purchases.
Buying centers and purchasing officers become efficient at buying through narrowing the buying cycle to three encounters: new-task or first-time purchases, re-buys and modified re-buys. However, they still give consideration to the post-purchase evaluation stage to determine whether to establish and/or sustain a long-term business relationship with a supplier. For many product and service firms, this is when the metric of the lifetime value of a customer can play an important role in sales forecasting, as well as provide better management of profitable customer relationships.
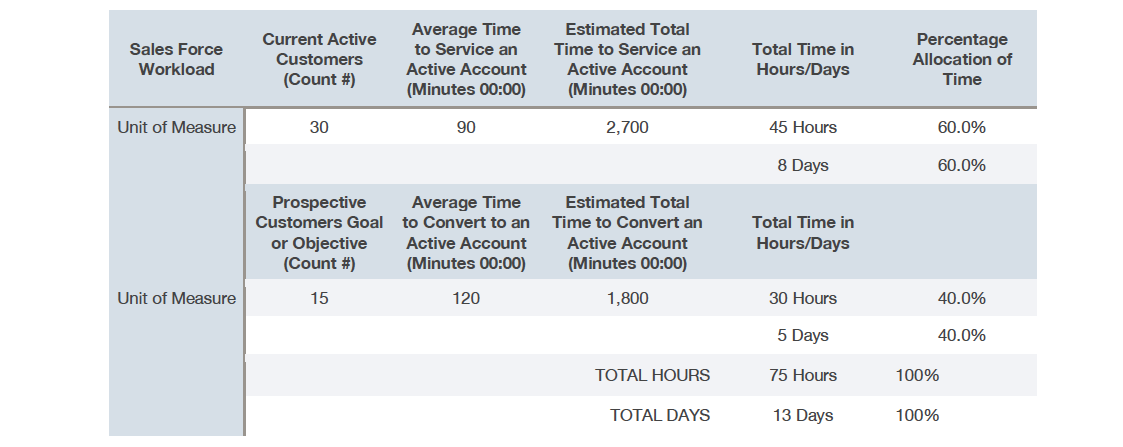
The chart above shows a simple example of how data collection and analysis can provide a useful fundamental metric.
Assume there are 20 working days (e.g., five days per week) in a month or 60 working days in a quarter. So, both the sales manager and the salesman can see that it should take eight days or 45 hours to maintain the accounts and five days or 30 hours to generate new accounts.
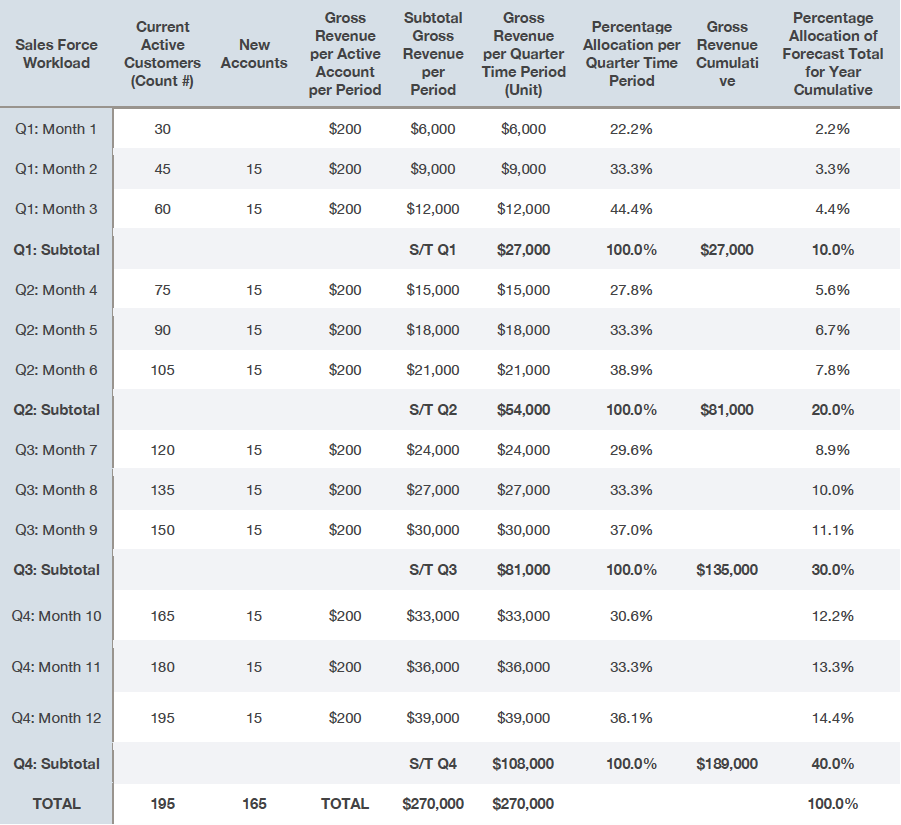
A salesman might allocate about 13 days to account activities, leaving seven days per month for administrative obligations or other efforts such as training or professional development. Alternatively, over a quarter, 36 days would be available to maintain accounts and 24 would be available to generate new accounts. After the first quarter, the firm could project 75 active accounts and be on its way to an additional 165 by the end of the year. See chart at right.
The easy measure is gross sales revenue per account. However, it’s best to think about sales potential in terms of profitability or net cash flow. The simplest way to measure this is by determining effective buying power per account (e.g., gross sales revenue) and then deduct cost of goods sold and associated selling and administrative expenses.
To continue the example from above: Let’s assume you sell a service or product equal to $200 in gross sales revenue per month. This could be as common as paper and printer toner. It could be a service business such as repair service. Or it could be an intangible such as a customer’s insurance installment or financial services.
If every active account is valued at $200 per month, then the calculation for the first month is 30 active accounts times $200, or $6,000. The calculation for the next month would be $200 per active account times 45 active accounts (original 30 plus new 15) or $9,000. And so on until the end of year, which would be forecast to result in a cumulative total of 195 accounts and gross revenues of $270,000.
However, there is an underlying cost to produce the product or service and selling and administrative expenses associated with most products and services. In our example, let’s use 35% for cost of goods sold and 10% for selling and marketing expenses and 5% for administrative overhead. Each is represented as a percentage of gross sales revenue.
Therefore, cost of goods sold for each unit (product or service) is $70 and selling and marketing expense is $20 and administrative overhead is $10.
As a result, net profit is $100 per unit. Calculated as $200 less $70 for cost of goods sold, less $20 for marketing and $10 for administration. Effectively a profit of $100 for each unit or 50%, or $100 profit per $200 gross sales. The return on investment is calculated as the profit divided by the cost to produce the sale in this instance. Therefore, the ROI is 100% ($100 profit per $100 all-in-costs).
Now, many would ask, “So what?” The benefit of thinking in these terms provides metrics that can be adjusted and used to forecast given changes in any one of the elements. So, if production costs go up or are trending down, that has an impact on cost of goods sold and when considered in light of its total percentage of the built-up investment can influence the price level and competitive price position, in addition to the customer or client’s perception of the value proposition and his desire to buy.
The collection of data on selling and marketing expenses and administrative overhead can be used in forecasts and projections that become the foundation for budgets and sales force program goals. They can be adjusted and yield valuable insight into the firm’s investments made or likely to be made in a particular product or service offering.
Again, if either one of these cost elements goes up or down, it too can have a direct effect on the total investment for the firm and not only affect its price. More important, management can evaluate it in the context of established goals and objectives set out for maintaining the profit targets and ROI goals put forth in the yearly plan of the firm and influence the sales force efforts and efficiency targets, as well as sales projections.
There is an additional benefit derived from evaluating these metrics. They also allow you to evaluate your competition. It’s often not hard to break down a competitor’s product or service offering and their value proposition into similar elements and determine where they might be achieving a competitive advantage and where your offering and value proposition are superior. This often helps most when the sales force is delivering presentations in a highly competitive marketplace and presenting a product or service that is hard to differentiate on features alone.
The additional value-added of having a knowledgeable sales force (not acting as a product expert, but also a market expert and industry expert) is a game changer. When empowered with the ability to understand the profitability and returns for the firm, they can fulfill the customer’s needs or provide a cost-effective solution that solves a problem. Even better, they will more often exceed the buyer’s expectations and make better business decisions that favorably affect long-term relationships through delivering both competitive pricing and earning sustainable profits.
Feel free to contact me at The Business Journal in Youngstown – sales101@business-journal.com.
Copyright 2024 The Business Journal, Youngstown, Ohio.