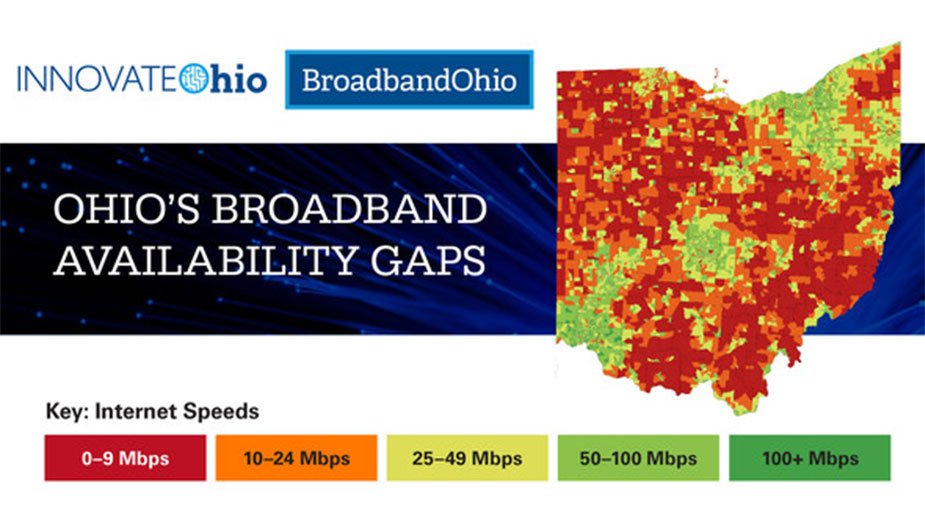
YOUNGSTOWN, Ohio – A color-coded map released by BroadbandOhio March 1 indicates the parts of the state where a lack of high-speed internet availability is most prevalent.
However, the number of residences in the Mahoning Valley that have such access – as well as residents who take advantage of the access they do have – might be worse than the map suggests, says Patrick Kerrigan, director of the Oak Hill Collaborative.
Maps for each of the 88 Ohio counties were developed using data from on-the-ground Ookla Speedtest Intelligence records over a 15-month period. The tests measured four internet speeds: up to 10 megabytes per second, or Mbps, up to 25 Mbps, up to 50 Mbps and 50-100 Mbps.
Unlike Federal Communications Commission Fixed Broadband Deployment Data maps that use data reported through internet service providers, the new map uses “real-world, on-the-ground speed test information from actual internet customers to determine where there are gaps in coverage,” according to a release from BroadbandOhio.
The maps are based on a rating system developed by Reid Consulting Group LLC. Data sources include the Ookla data, carrier filings of available speeds with the FCC Form 477, and carrier reports of actual broadband deployments.
However, that data might not be 100% reliable, Kerrigan contends. There may be instances where residences located in an area that’s defined as having high-speed internet still can’t connect. Data can be particularly misleading in high-density areas, such as the Youngstown area, he says.
“That’s been a uniform complaint with FCC data, that it’s based on aggregate information that’s misleading as to individual cases,” he says. “I think there’s a lot more people that don’t have access.”


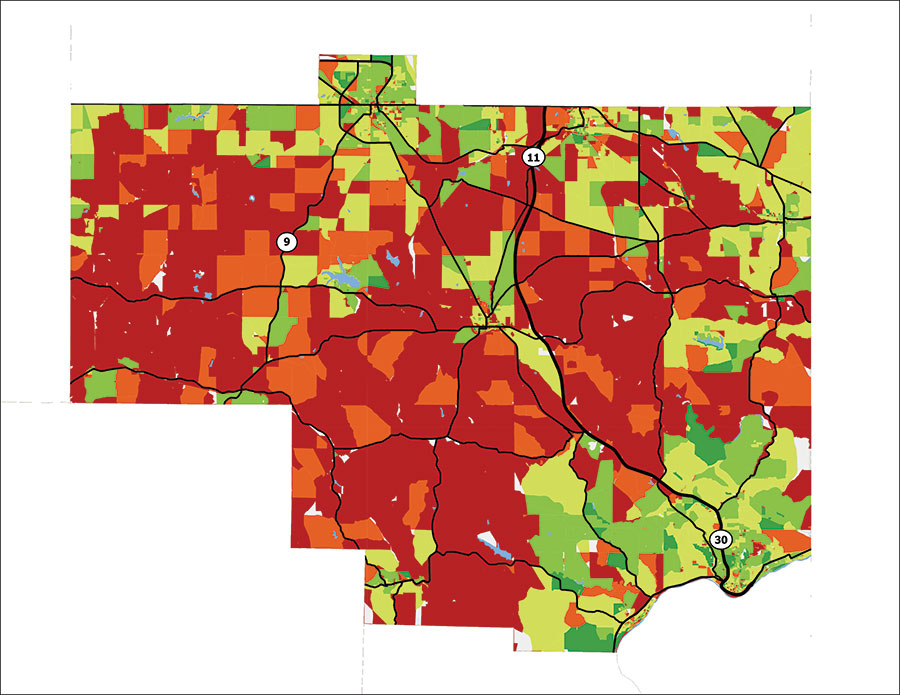
Gallery images include broadband profile maps for Mahoning County, Trumbull County and Columbiana County.
According to the maps, 27% of the populated area in Mahoning County and 10% of households don’t have access to internet speeds of 25 Mbps download/3 Mbps upload – the minimum speed for broadband as defined by the FCC.
Of the 114,165 households in Mahoning County, 11,817 are in areas that only have access to speeds below that 25/3 Mbps minimum, and 46% of those households are in areas where speeds are below 10/1 Mbps.
The southwest portion of the county appears to have the worst accessibility. Portions of the Youngstown area also have poor connectivity but are surrounded by areas that have better connectivity.
In Trumbull, 39% of the populated area and 13% of houses do not have access to the minimum speed. Of the 96,219 households in the county, 12,670 are below that benchmark, and more than 6,000 don’t have access to more than 10/1 Mbps.
Columbiana appears to be the worst in the three-county area in terms of accessibility. There, 67% of the populated area and 28% of households do not have access to the 25/3 Mbps minimum. Of the 48,611 households in the county, 13,739 are in areas that offer below the 25/3 Mbps minimum and 9,123 can’t get better than 10/1 Mbps.
One reason for the gaps is internet service providers target more densely populated areas to install their networks to ensure they bring on enough customers to recoup their investment.
The maps will be helpful as local governments consider using different funding resources and opportunities for public-private partnerships to close connectivity gaps, according to the release. They will be used to supplement existing data available to BroadbandOhio, residents, elected officials, internet service providers and other stakeholders.