Use Google Analytics To Improve Your Website
Google Analytics is a free tool that tracks and gathers data from the people who visit your website. The system uses a JavaScript code that collects and processes data that is then presented to you in the Google Analytics platform.
A tracking code will collect anonymous information on how users interact with your website. It will tell you how many users visited a page, how long they were there, which pages they visited and where they went next on your website. The code will collect browser information such as language, browser type, device and traffic source.
Google Analytics breaks the data into five reporting categories:
Real-Time: What’s happening on the website right now?
This category shows how many people are on your website right now, where they came from and what content (which page) they’re looking at.
There are two scenarios where this report can be useful. First, it shows you live website data, which is especially helpful when you set up custom events (like clicks on a marketing email or links shared on social media). Second, the report can track and possibly optimize the performance of short campaigns.
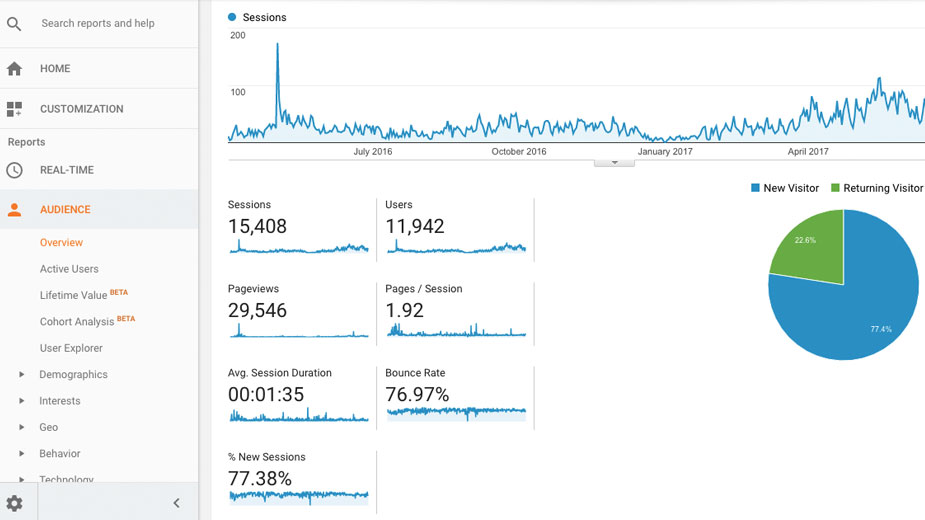
Audience: Who visits your site?
Audience reports provide information on who has visited your website. This includes demographic information about their age, gender, location and language. Depending on your small business, you might want to look into different reports, but a common category every business should monitor is the mobile report.
The mobile report will show you what percentage of your website visitors come from a mobile device, desktop or tablet. Mobile device usage continues to grow and for many websites, it’s the device used the most. This is crucial to monitor because people navigating the internet on a mobile device have different behaviors and objectives. They tend to be on the go and looking for information as easily and quickly as possible. If a big portion of your website traffic is coming from mobile devices, you should optimize your site for those users.
Acquisition: How did people get to your website?
Google Analytics automatically groups the channels people used to get to your website into some generic categories.
For example, if they used Google or Bing to find a website, they’ll be grouped into the Organic Search channel. If they arrived through a Facebook post, they’ll be grouped into the Social channel.
The number of people a channel drives to your website is not necessarily as important as the quality of people it drives.
Not every channel will be good at the same thing. While one can be good at increasing brand awareness, the other may be better closing deals or generating leads. Know and understand your strategy and objectives for each channel.
Behavior: What did people do on the website?
Within the behavior category you’ll see the most popular content (pages) on your website. Two reports that are helpful to understand what content people are most interested in are the Landing Page report and the All Pages report.
Landing pages are the ones where people arrive to your website. You’ll likely see your homepage as the page that receives the most traffic, but below that, you’ll see others that give you an idea of what content is attracting people to the website.
The All Pages report will show you which pages get seen the most by people who visit your website. If you don’t see some of your most important pages in this report, it’s a cue to look for ways to improve the user experience and make the pages more prominent or relevant.
Conversions: Which goals did people complete on your website?
This report depends on the way you’ve set up your Google Analytics account. Goals (such as requests for information, form completions, calls, or emails to your business, for example) and e-commerce (sales) require a more advanced set up. You’ll need to tell Google Analytics what you consider to be the specific action you want completed (goal) on your website.
Copyright 2024 The Business Journal, Youngstown, Ohio.