By George Farris
YOUNGSTOWN, Ohio – What do you say when your child complains about his math homework and asks, “When will I ever need to know what 2,247.67 divided by 96.7 equals?”
You say something like, “You won’t need to know that exact answer but it’s helpful to know the problem-solving process.”
That’s a lie, of course, because in the real world everyone uses his cellphone or computer to do math. You figured you had to say the responsible thing.
Every time I read marketing statistics, I ask myself, “When am I ever going to use these numbers?”
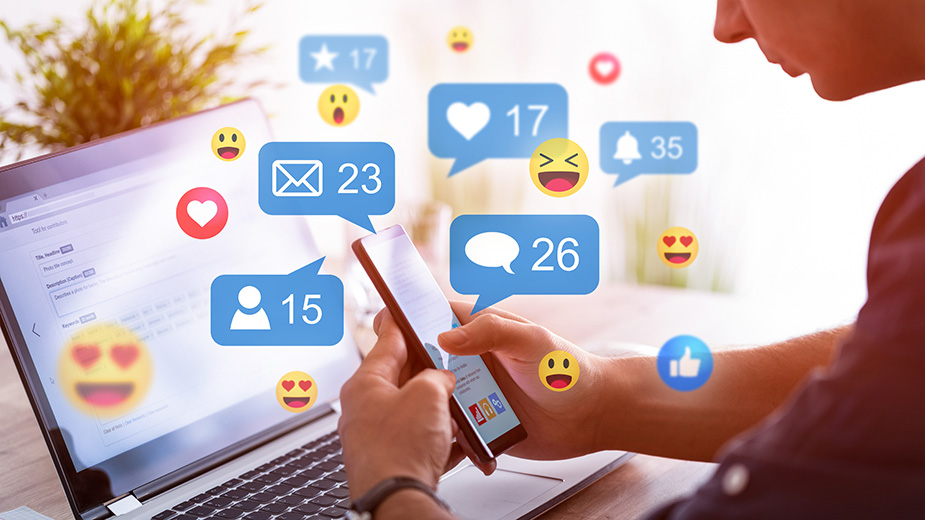
The sheer volume of social media stats can be overwhelming. But the numbers that matter to marketers are stats that illustrate trends, numbers that tell us what our customers and prospects are doing, numbers that show what interests them. We also want stats that tell us where we can find our customers and prospects when we want to sell them something.
SOCIAL MEDIA STATS FOR MARKETERS
Research shows that 71% of consumers who have a positive experience with a brand on social media are likely to recommend that brand to others. According to Zippia, 73% of marketers agree social media has been “somewhat effective” or “very effective” for their businesses.
The key social media platforms that marketers care about are Facebook, Instagram, Twitter, Linked-In, SnapChat, TikTok and a few others. Our interest is in key demographics, use, engagement and ad insights.
As an example of stats that matter to marketers, I’m sharing the numbers about Facebook, the largest social media platform in the United States. Most of the stats come from Statista and a few other reliable sources reported by SocialPilot.co in February.
FACEBOOK STATS OF INTEREST TO MARKETERS
Who? Eighty-one percent of all adults in the United States have an account on Facebook; 71% actually use it. According to Statista, 75% of high-income earners use Facebook. Teens who used Facebook fell from 71% in 2022 to 32% in 2014. Sixteen percent of Facebook users are fakes or duplicates.
How? More than 98.5% of users access Facebook from mobile devices; 85% of smartphone users have the Facebook app.
How often? Most of the U.S. adult population on Facebook uses the platform daily; 49% use it several times a day. The average U.S. adult spends 30.1 minutes a day on Facebook.
For what? Thirty-one percent of American users use Facebook to read the news. Twenty-six percent of U.S. adults preferred Facebook Live as their livestream shopping platform. Live video engagement is 26% on Facebook, higher than any platform.
Marketing: Eighty-one percent of businesses share videos on Facebook. Fifty-seven percent of the brands on Facebook believe stories effectively promote their products. Influencer-published videos account for about 60% of Facebook video views in the United States. A video post increases interaction by 600% on Facebook.
Over 70% of Facebook users view local business pages at least once every week. Forty-four percent of users admit that Facebook influences their shopping decisions; 15% of users shop on Facebook.
STATS VS. MATH
You don’t need to know much math to realize how important the above stats are to marketers. It’s obvious that you need to promote your organization on social media. And in case you’re wondering – 2,247.67 divided by 96.7 equals 23.24.
George Farris is CEO of Farris Marketing. Email gff@FarrisMarketing.com.